CSES-01 observations of the August 5, 2018 Bayan Earthquake (EQ)
CSES-01 observations from Electric Field Detector (EFD), Search Coil Magnetometer (SCM) and Langmuir Probe (LAP) instruments of the August 5, 2018 Bayan Earthquake (EQ).
EFD Observations
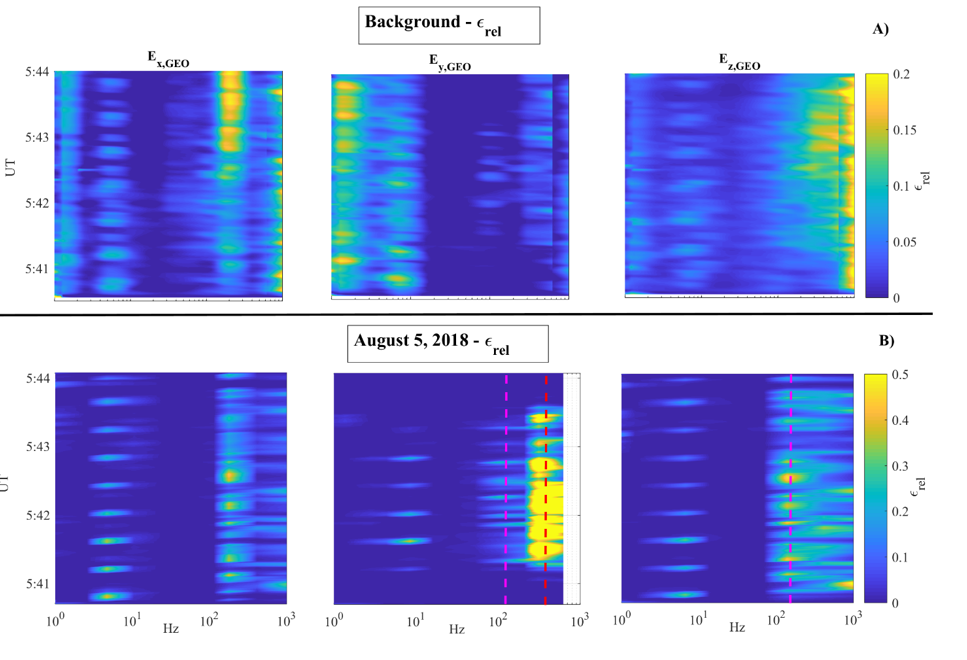
Figure 1 B) The relative energy evaluated for the August 5, 2018. The Schumann resonance peak at ~7.9 Hz is clearly visible in all components. Anomalous peaks at ~180 Hz along Ey and Ez (magenta vertical dashed lines), and at ~630 Hz along Ey (red vertical dashed lines) can be easily identified with respect to the background.
SCM Observations
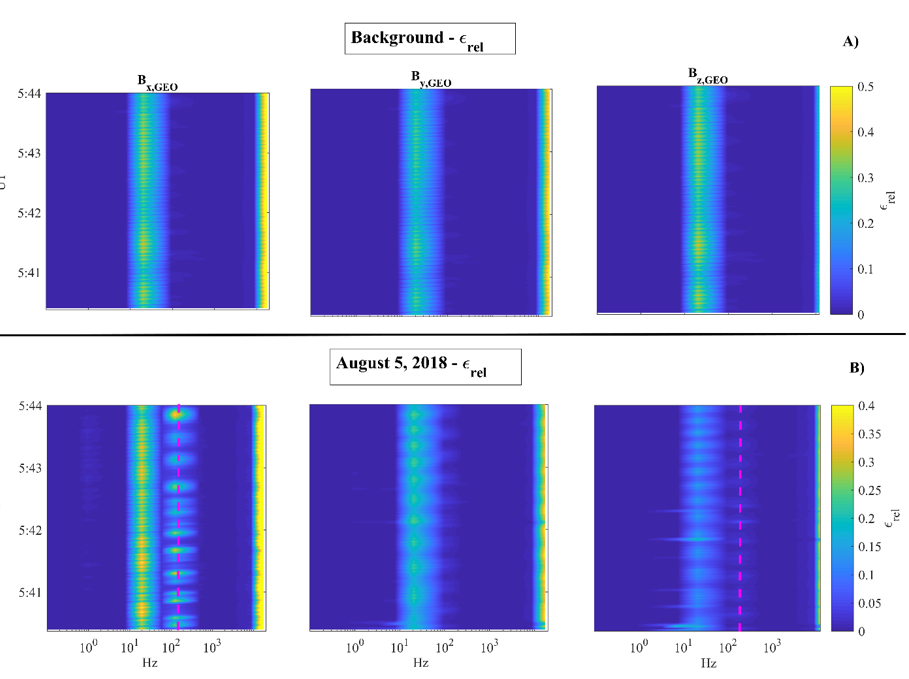
Panels 2A) The background where clear is the signature of the second Schumann ionospheric resonance at ~20 Hz. A peak is clearly visible also at 12 kHz, probably related to the lower-hybrid resonance of the ionospheric F2 layer.
Panels 2B) The relative energy of the SCM on August 5, 2018. The second Schumann resonance is clearly visible in all components and an anomalous peak at ~ 180 Hz appears along Bx and Bz (magenta vertical dashed lines). Such oscillation has the same frequency of and is perpendicular to the one detected in the EFD data. As a consequence, it is an electromagnetic wave. The analysis of the Poynting flux confirms that such electromagnetic wave propagates upward.
LAP Observations
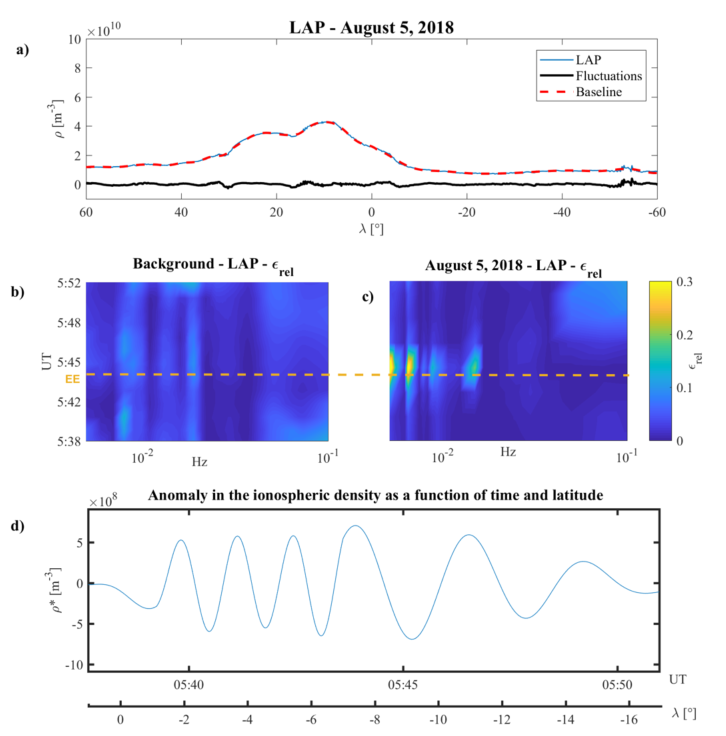
Panels 3b) and 4c). The LAP background relative energy evaluated from August 2018 to November 2019 for solar quiet conditions and the August 5, 2018 εrel, respectively. Two anomalous density components switched on between 5:39 ± 00:02 UT and 05:50 ± 00:02 UT characterized by T1= 67±1 s and T2=111±1 s peculiar periods.
Figure 3d), Plasma density anomaly (ρ*) obtained by the superposition of the two frequency components, T1 and T2. It can be easily seen that the ρ* switches on near the EE, reaching its maximum values at EE and then vanishing.
In conclusion, in the case of the Bayan earthquake the data of the three instruments show about 5 hours before the EQ occurrence a clear signature of the lithosphere-ionosphere coupling that could be explained via atmospheric AGW emission. Moreover, for CSES flying over the earthquake epicentre (EE), both EFD and SCM show a clear signature of electromagnetic (EM) emission at 180 Hz and a plasma wave propagation.