Analysis of the 28 September 2018 Palu (Indonesia) Mw=7.5 earthquake
On 28 September 2018 Indonesia was hit by a strong earthquake (Mw=7.5) that caused more than 2000 victims. Retrospective investigation of the data acquired by some payloads on-board CSES-01 satellite permitted to detect several ionospheric anomalous signals that could be possibly related to the preparation phase of such a powerful earthquake. It is fundamental to note that the reported anomalies are only potentially associated with this earthquake because, despite all the precautions, we cannot rule out that similar perturbations can be caused by other sources as well. Therefore, they cannot be yet used to make a prediction of a future event for which more research is necessary. On the other hand, this kind of study allows us to make significant steps forward to understand the physics underlying the preparation phase of a large earthquake.
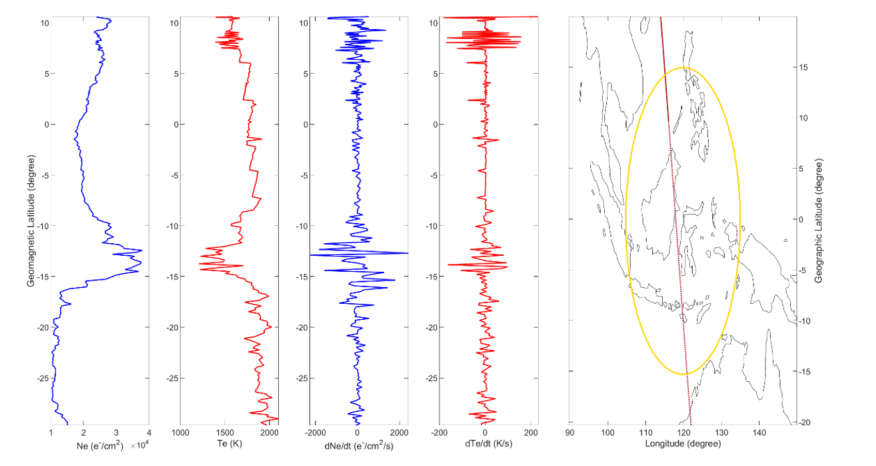
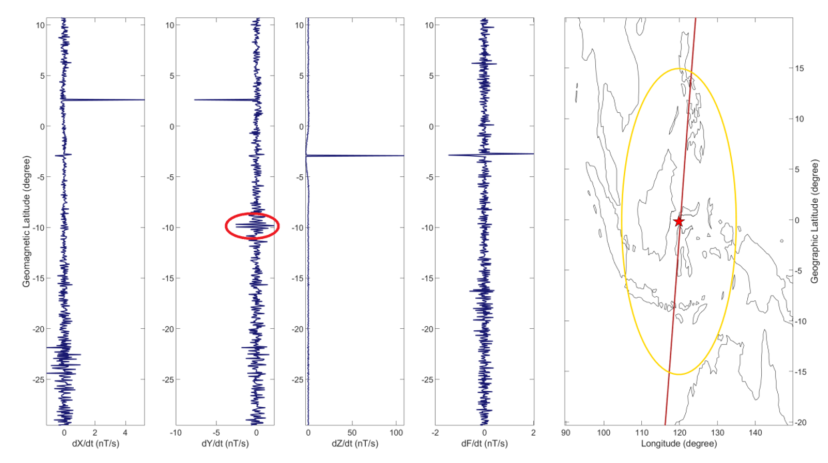
In particular, CSES-01 was able to detect two types of anomalies possibly related to the impending earthquake: absolute and relative anomalies, both taken during quiet magnetic times, i.e. not disturbed by any geomagnetic storm. The first type of anomalies is a change of the absolute value of the parameter under study: in this case, we found an increase of the electron density (the amount of free electrons for a cubic centimetre) above the epicentre as part of an Equatorial Ionospheric Anomaly (EIA) that normally occurs only during the local daytime. The second type is a relative variation of the parameter of interest, detected as rapid oscillations of magnetic field and electron density above the epicentre at the CSES-01 altitude (~ 505 km). Regarding the absolute type of anomalies, the following picture shows a reconstruction of the electron density on the night of 19 August 2018, i.e. more than one month before the earthquake. It is possible to note a higher level of its value (not expected for the night-time standard behaviour of the ionosphere) that is contained inside the preparation area (defined by the Dobrovolsky radius that scales with magnitude) used for the investigation and represented by a yellow circle.

Searching for the second type of anomalies, i.e. rapid variations of some ionospheric quantities, it was possible to extract several anomalous tracks of electron density, electron temperature and magnetic field. The following figures show two interesting examples.