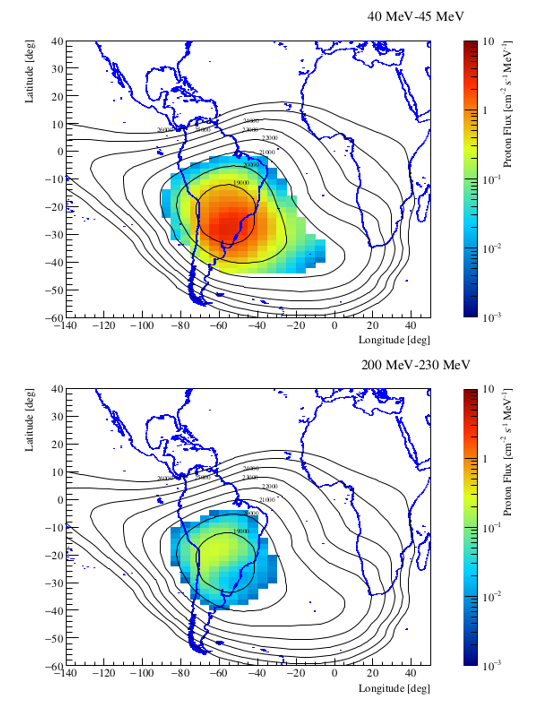
Figure 1. Geographical map of omnidirectional proton fluxes in the period August 2018-December 2020 for a low energy bin (40-45 MeV, upper panel) and for a higher one (200-230 MeV, bottom panel). In both panels, the isolines of the reconstructed magnetic field are also shown for clarity. SAA region defined by B<20500nT magnetic field and L-shell parameter L<1.3 Low-energy protons are present in almost the whole Anomaly region, while the high-energy ones are concentrated in the innermost area.
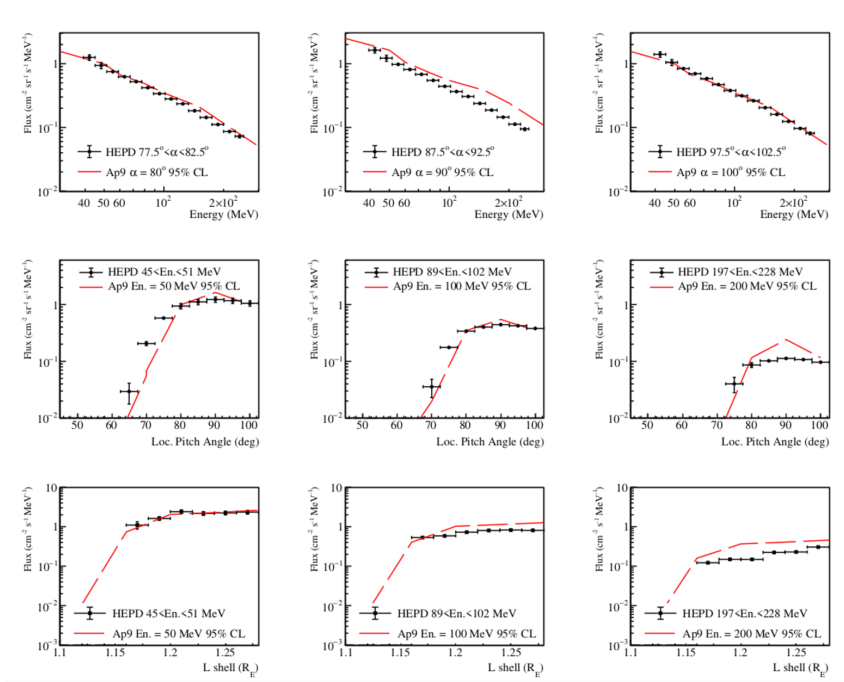
Figure 2. HEPD-01 results averaged over the period between August 2018 and December 2020, compared with the AP9 model predictions for the same period. In the top panel the fluxes as a function of the particle energy and for three different pitch angle bins are reported. In the middle and bottom panels fluxes are displayed for three different energy bins, as a function of the local pitch angle and the L shell. Data and model show a high consistency between each other, with a worsening of the agreement in the higher energy interval.